Last Updated: 19 June 2023
Library Data Analysis
2023 / Excel (CSV), MS Access, NoSQL, Tableau
San Francisco Public Library Data Usage
About this dataset: Containing anonymized data usage by over 420,000 patrons, this dataset was sourced through Kaggle here.
Data Overview
Before diving too deeply into the data, I wanted to examine things from a broad perspective. Using Excel pivot tables, I created the following visualizations regarding checkouts, patron registration year, and the correspondence between these two entities.
- Rise of Non-Users
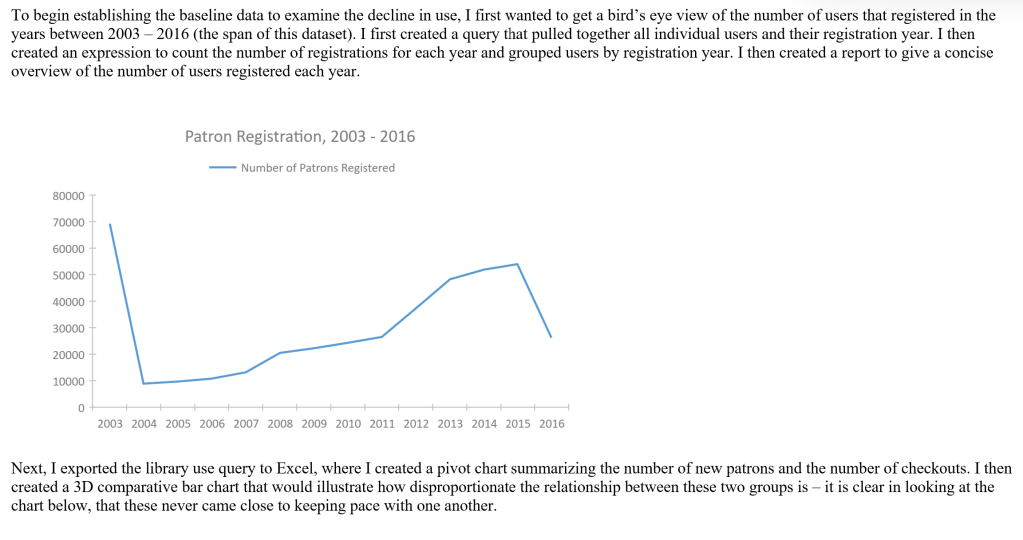
To begin establishing the baseline data to examine the decline in use, I first wanted to get a bird’s eye view of the number of users that registered in the years between 2003 – 2016 (the span of this dataset). I first created a query that pulled together all individual users and their registration year. I then created an expression to count the number of registrations for each year and grouped users by registration year. I then created a report to give a concise overview of the number of users registered each year.
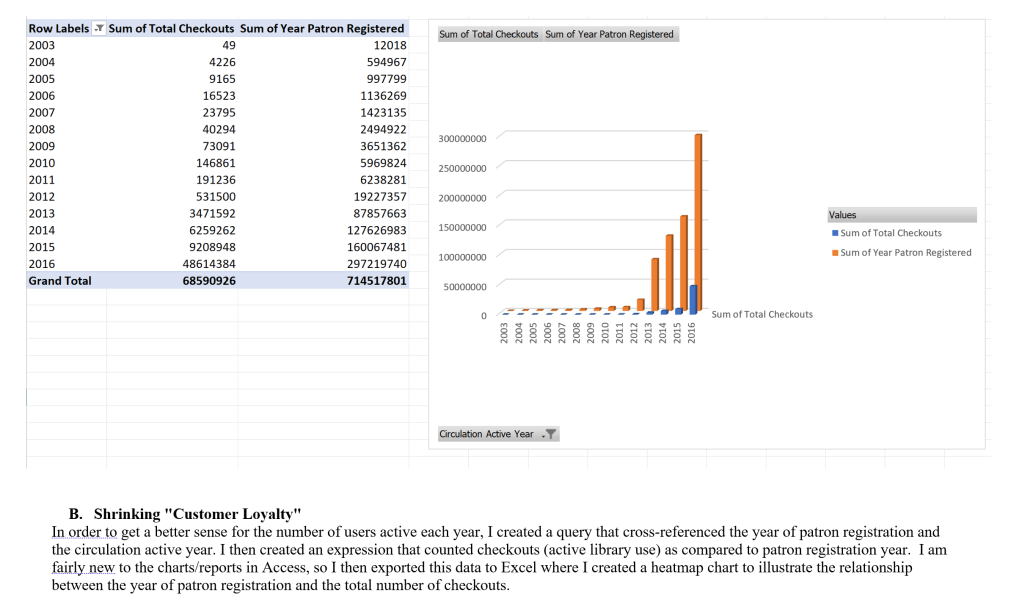
I exported the library use query to Excel, where I created a pivot chart summarizing the number of new patrons and the number of checkouts. I then created a 3D comparative bar chart that would illustrate how disproportionate the relationship between these two groups is – it is clear in looking at the chart below (2. Customer Loyalty), that these never came close to keeping pace with one another.
Library Use Analysis

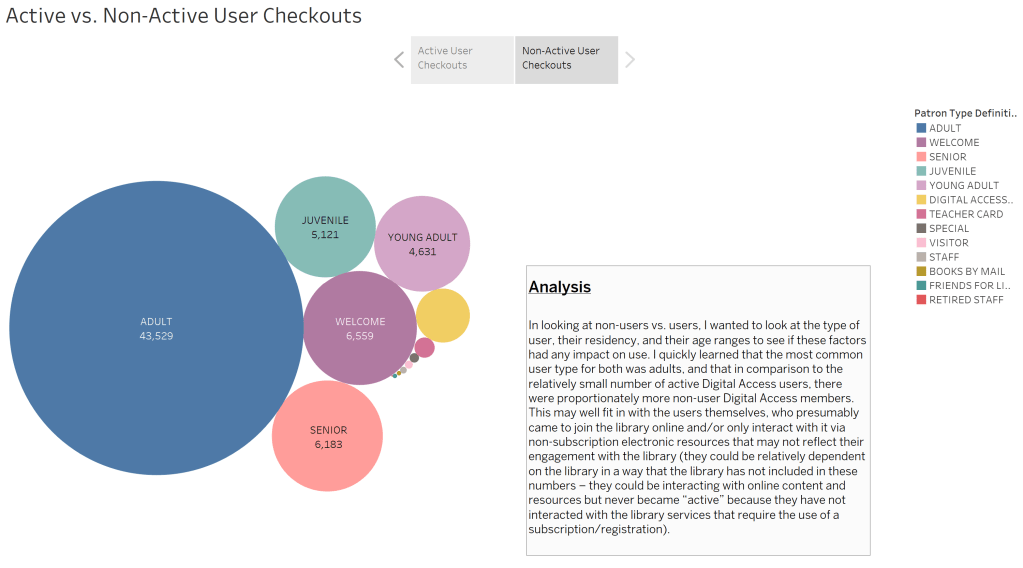
In looking at non-users vs. users, I wanted to look at the type of user, their residency, and their age ranges to see if these factors had any impact on use. I quickly learned that the most common user type for both was adults, and that in comparison to the relatively small number of active Digital Access users, there were proportionately more non-user Digital Access members. This may well fit in with the users themselves, who presumably came to join the library online and/or only interact with it via non-subscription electronic resources that may not reflect their engagement with the library (they could be relatively dependent on the library in a way that the library has not included in these numbers – they could be interacting with online content and resources but never became “active” because they have not interacted with the library services that require the use of a subscription/registration).

Here, it seems the 10 – 19 age group has the highest number of checkouts, though it is a close number as compared with the 45 – 54 and 65 – 74 age ranges.
To expand further into this line of inquiry, I decided to look at checkout numbers, as these give a clearer picture of what is driving circulation. I was interested in exactly how the circulation numbers changed over time, and if the same age groups were more active or if there were some potential changes, maybe due to the expansion of programming aimed at a specific group or an effort on the library’s part to be more active in outreach.

As is visible in this heatmap, the proximity between multiple age groups is clear, though some very interesting information is visible here. The proportional growth of these groups in the last year of available data is staggering to say the least. The age groups 65 – 74 and 0 to 9 years both increased tenfold between 2015 and 2016. That kind of growth falls well in line with the fact that there was a universally significant jump in membership in 2016. This aspect of the user base will be discussed in a later section regarding the branch expansion.
Local Branch Data and Analysis

Though this is fairly straightforward, there are a few things in the above chart worth noting. Remembering that this data represents library use from 2003 to 2016, the top three libraries in library circulation are the Main Library (21.14%) and Chinatown (9.04%), both branches opened in 1996. This means that both of these branches were well-established and firmly rooted in the SFPL system before the start of this dataset. The Richmond branch (7.69%) opened in 2009, yet has surpassed all but the Chinatown and Main Library branches in this dataset (2003 – 2016).
Branch Expansion Data


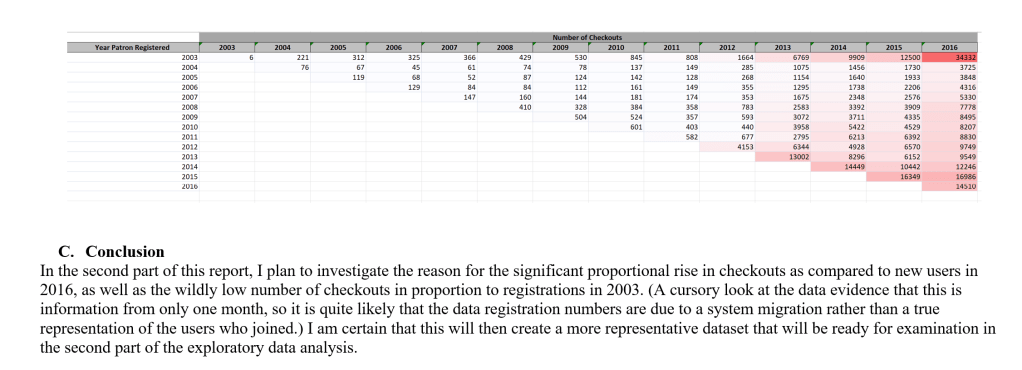
When looking at the above data regarding circulation and renewals, there is quite a spike in 2016, which begins its upward trajectory in 2012. Looking into the history of SFPL, one notes that there was a rapid expansion and addition of several new branches during this interval. This certainly helps explain how circulation numbers doubled between 2011 and 2012, and by 2016 circulation numbers were almost 24 times greater than 2011
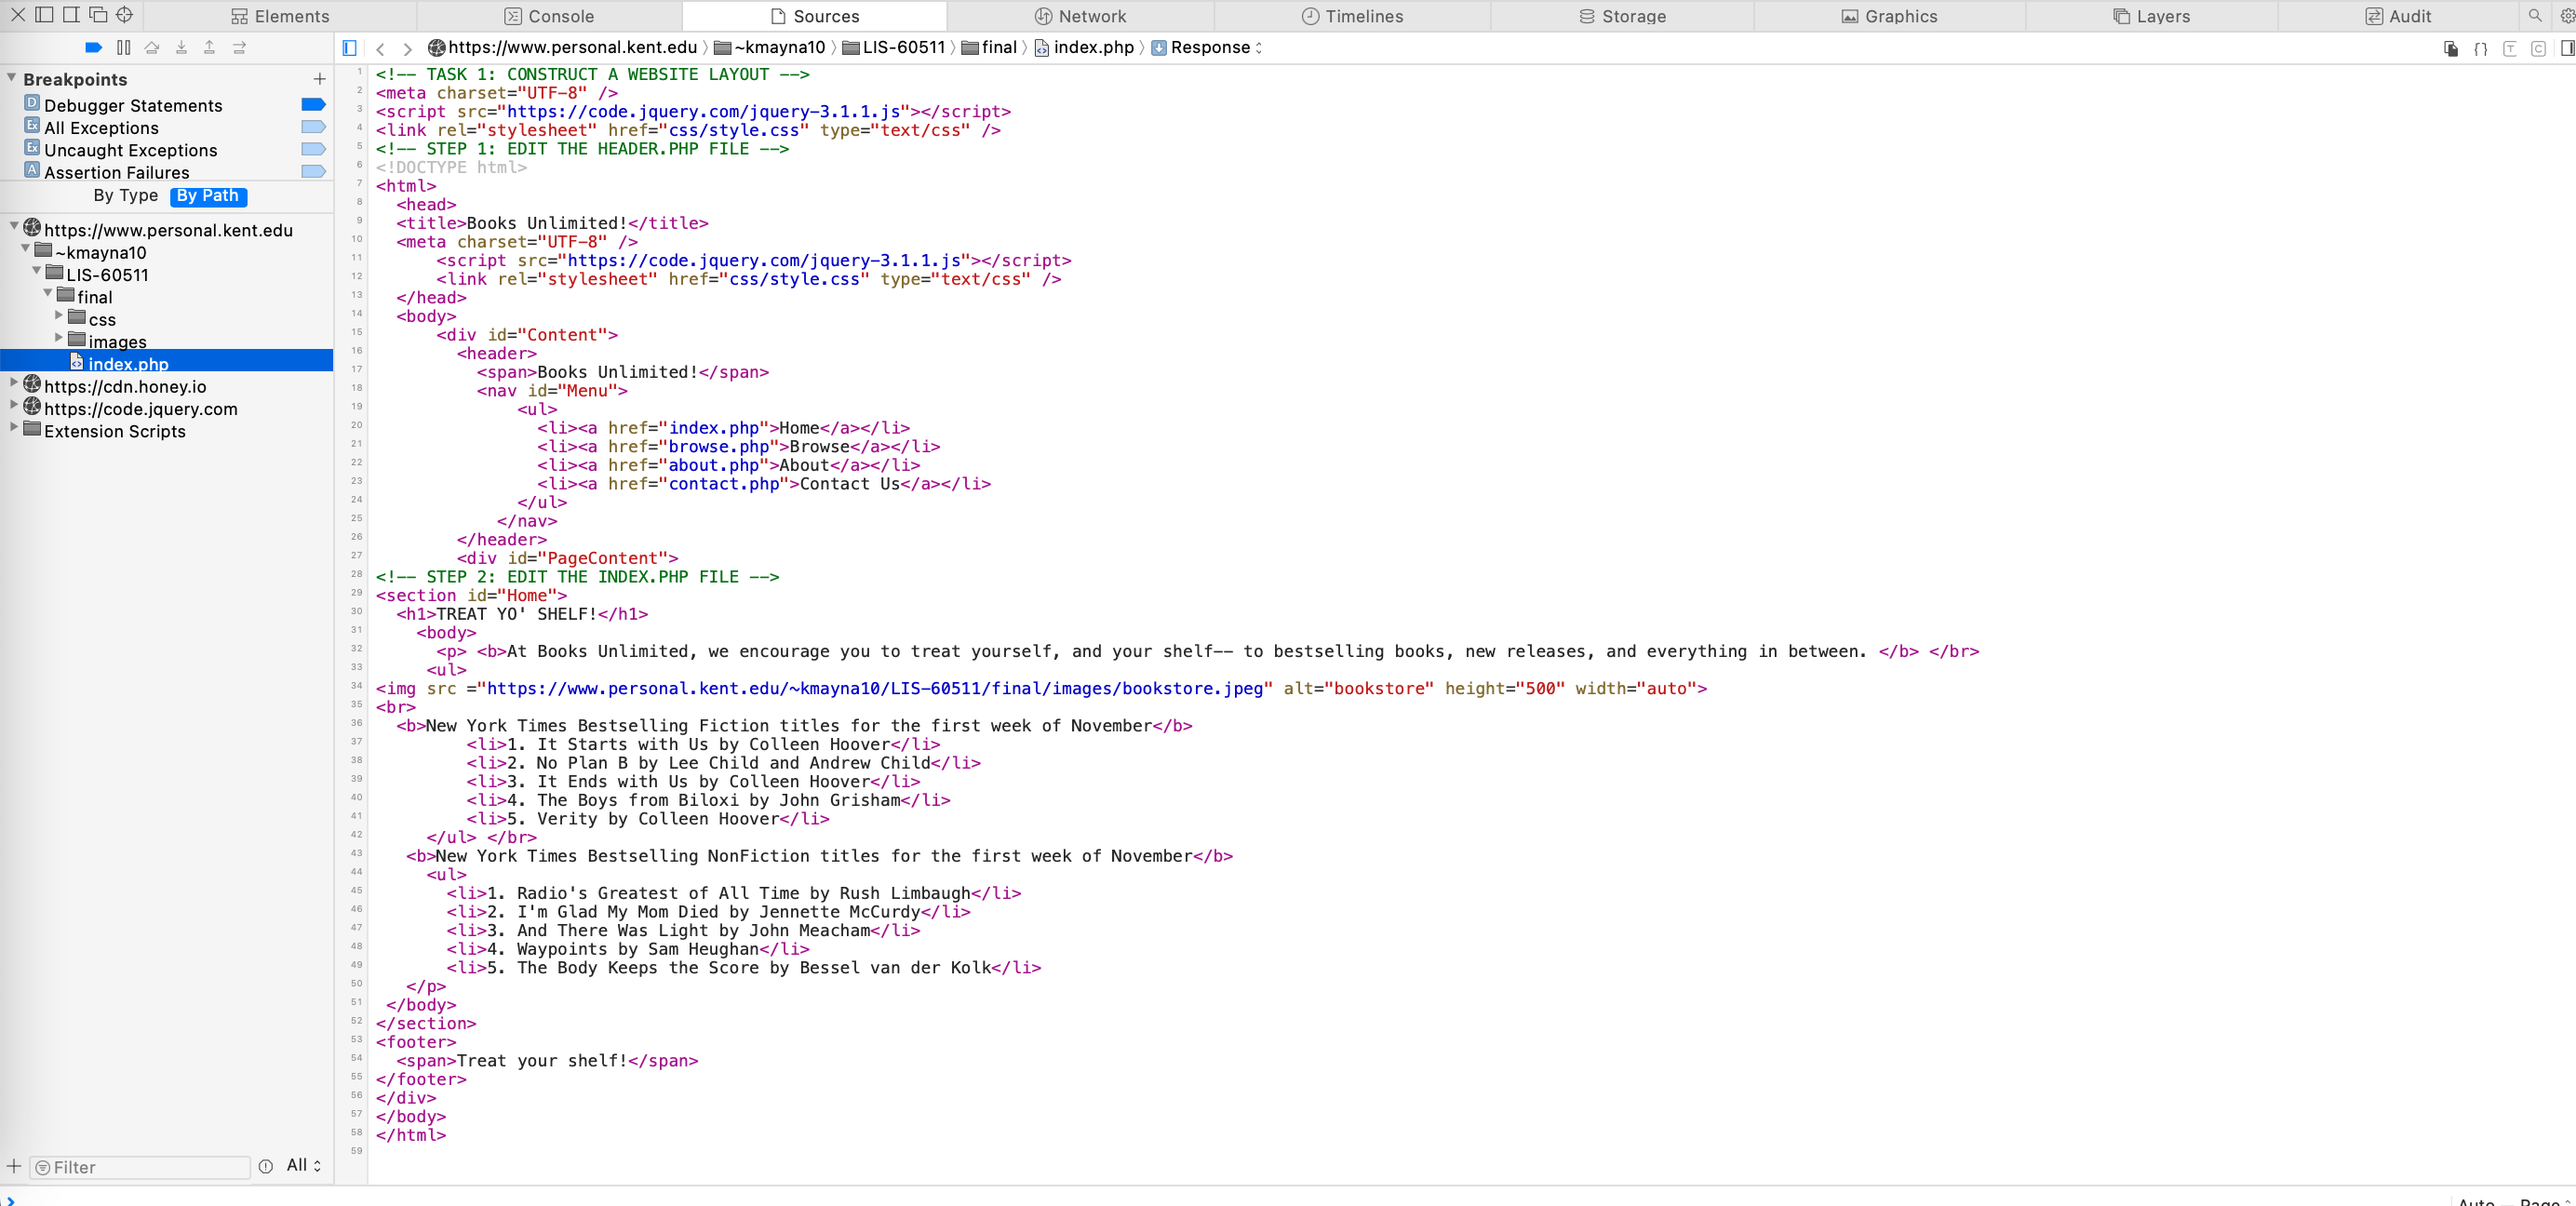
Building a Dynamic Website
Last Updated: 12 June 2023
2023 / Web Development, HTML, CSS, JavaScript, PHP, JSON, REST API
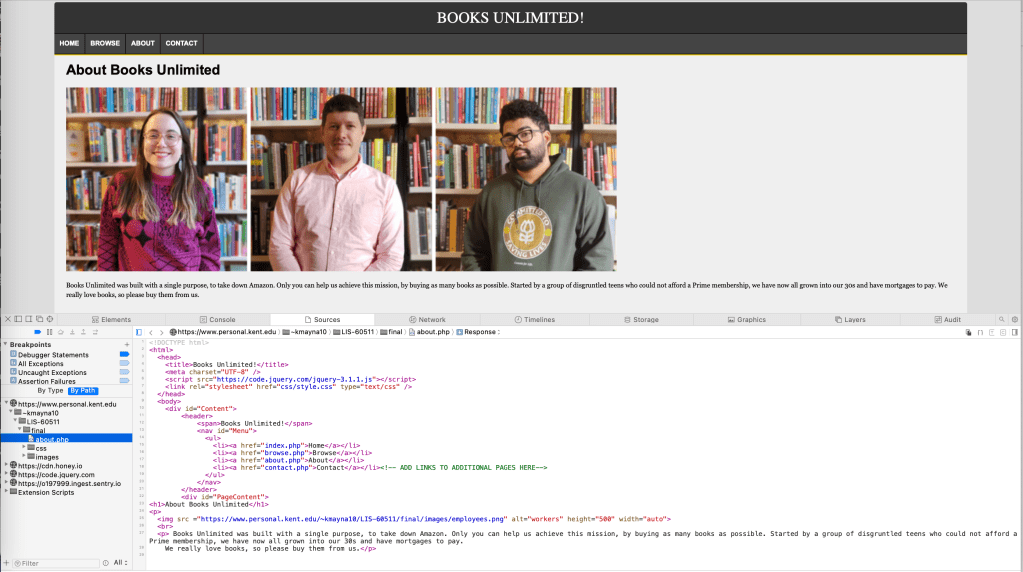
Goal: To generate a dynamic website using a range of development tools, including HTML, CSS, JavaScript, and PHP.
In addition, I added dynamic content using JSON and a REST API (The Open Library Books API).

Last Updated: 12 June 2023
Building a Simple Database
2023 / Information Architecture and Planning, Relational Database
Development, ER Diagrams
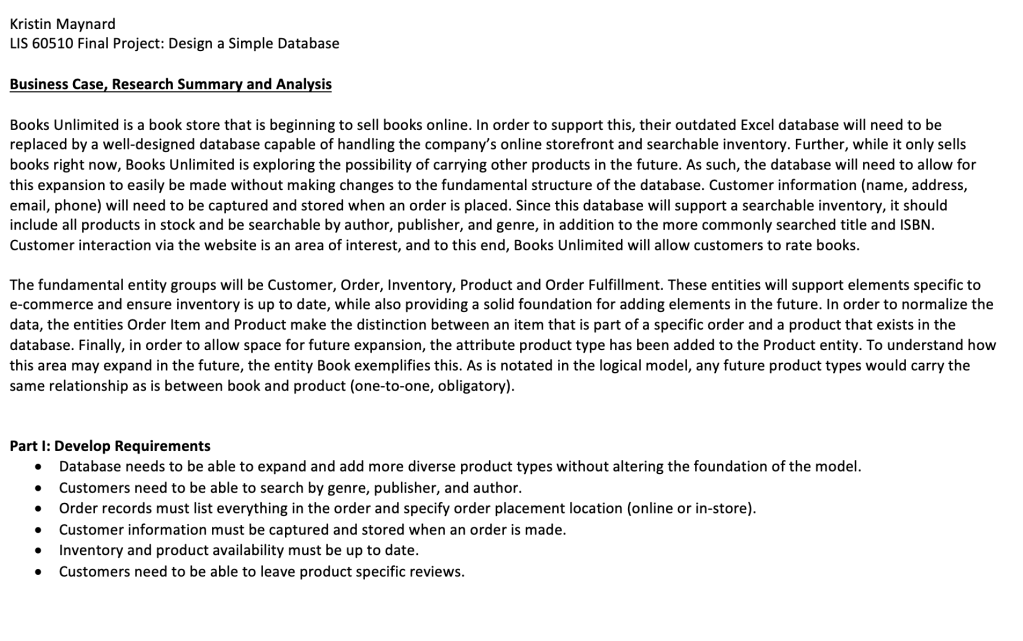


Simple Database for a Book Shop
P1. Business Case, Research Summary and Project Analysis.
P2. Conceptual Model
P3. Logical Model
Last Updated: 12 June 2023
Spotify Data Analysis
2023 / Data Anaylsis, SQL, SQLLite
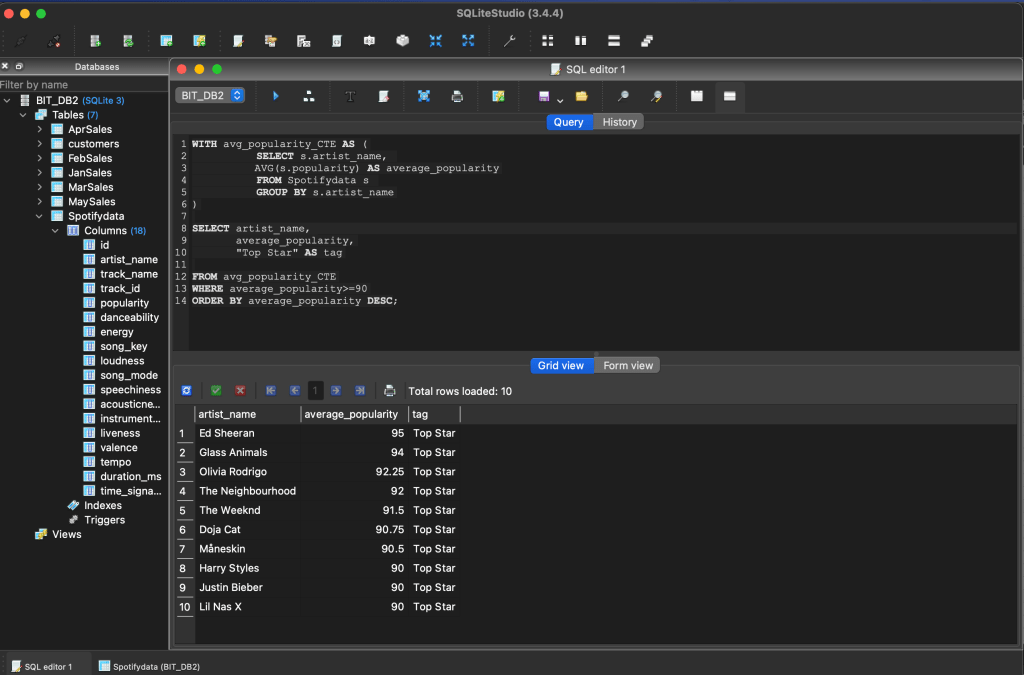
Goal: To take open source data and perform a range of SQL queries.
Using data from Kaggle, I generated a table in SQLiteStudio to analyze the Top 50 songs on Spotify from 2021.
A Look Back…
At the end of the year, my social media is filled with Spotify Wrapped screen captures. This tiny, individual visualization and simple data analysis takes the user’s history and gives them a summary of their top artists, songs and listening habits. The meteoric rise of TikTok continued, its influence on music distribution and listening habits is undeniable. Coincidentally, each of the artists pulled in this query for those musicians with a popularity rating over 90 are fixtures on TikTok.